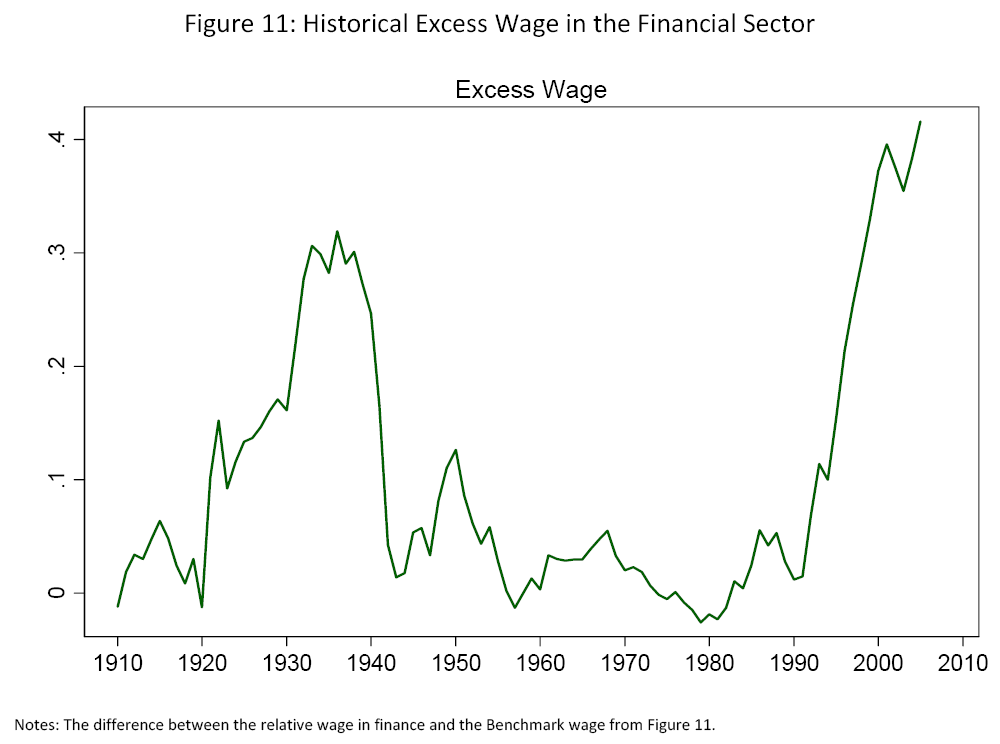
Wages of bankers in the US 1910 to 2010
This is one of the small signs of impending economic trouble that it has been, apparently, too easy to overlook. The size of the wage growth in the financial sector is roughly equivalent to the explosion in the financial credit markets. The secondary peak in the graph is what some people call the great depression of the 1930s. The benchmark wage on the upright axis of the graph is defined, I think, as the average wage in finance relative to the rest of US society. You’ll see it has only fallen below average in the mid-to-late 1970s during the recession of the Ford and Carter governments when the skills of bankers were actually not in great demand.
The chart is from an extremely serious-sounding academic paper called Wages and Human Capital in the U.S. Financial Industry: 1909-2006 by Thomas Philippon and Ariell Reshef. ( The link downloads the report pdf if you are keen).
Hat tip to Paul Kedrosky for the original research.
UPDATED: Noon. The Guardian has a fine selection of international investment banker mug-shots here.
UPDATED UPDATE. 1pm. CitiGroup and the new private jet. From the BBC. The FTs Alphaville offers alternative high-value employments – what, no cartooning?
